
Left: Laniakea Supercluster (source: www) Right: Gravity Curvature Map of South Australia, M. Zengerer
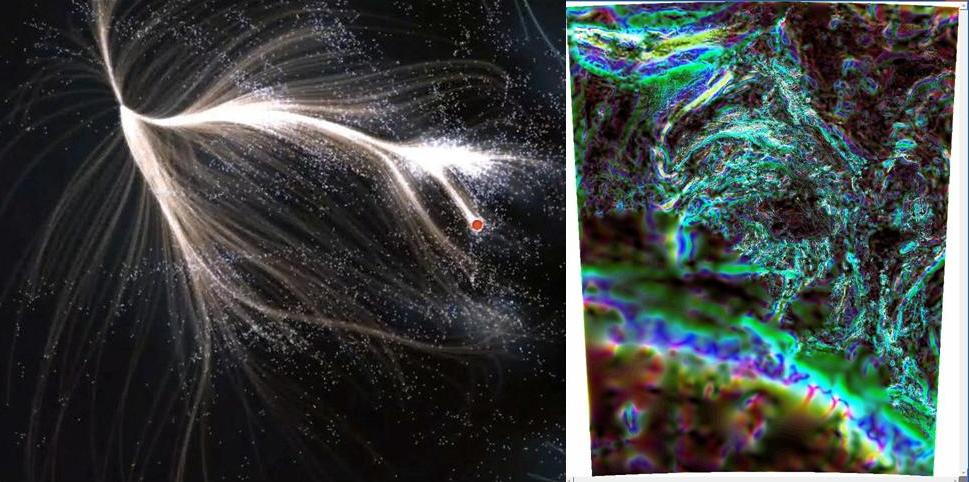
Hello Readers, I'm beginning a series of posts regarding trends in interpretative mapping in gravity and magnetics. Although my discussions will focus on gravity and magnetics, the broader applications can be spread through other types of geophysical data and through other disciplines, as can be seen. To begin with, what is the connection between the two images shown above? Although derived through extremely different datasets and processes, there is a common link: Gravity and Curvature of space-time. When Einstein considered processes important to general relativity, he realised that objects in space do not travel along straight paths, but along lines that are curved by the force of Gravity, which arises as a consequence of the curvature of spacetime influenced by concentrations of energy. The image on the left, which has gained a deal of excitement in the last couple of weeks, is an image of the Laniakea Supercluster, an image derived by processing the stellar motions of galaxies. What is it mapping? It is mapping the Curvature of the universe as influenced by objects of extremely high mass. It is also a 2D map showing an impression of Curvature in 4D space. Believe it or not, there are similar processes which can map the structure of the Earth, through variations in the distributions of mass in the crust. The image on the right, is a map of the Gravitational Curvature of the crust for the whole of South Australia. It is a 2D map of part of a 3D sphere. Interpretations of these maps, which reflect tectonic and astronomical events of the past, are part of the future of geophysical exploration. I'll explain the concepts of creating such maps over the next few posts. Thanks for reading.
Also published at: https://www.linkedin.com/pulse/curvature-gravity-maps-future-echoes-past-matthew-zengerer